Interactive lessons · Lightning and power systems
The Lightning Atlas
Three-dimensional, step-by-step animations of the lightning flash and of what it does to a power system. Built for university teaching and free to use in class.
Modules
Each module is a short film that you can pause, scrub and view from any angle. Start with the flash itself, then follow the current into the line.
The lightning flash
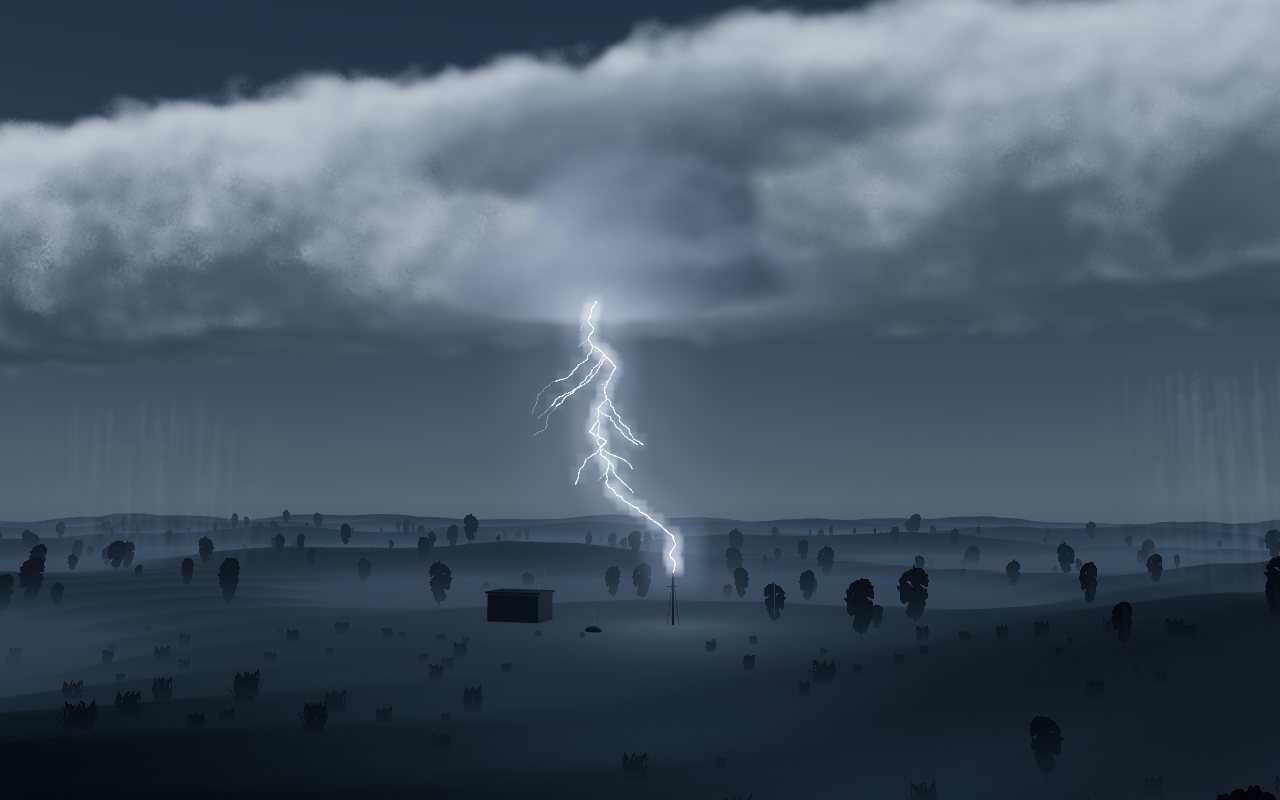
How a downward negative cloud-to-ground flash forms, from the charge in the thundercloud to the return stroke.
Part I
From Preliminary Breakdown to Return Stroke
A downward negative cloud-to-ground flash in seven stages: cloud charge, preliminary breakdown, leader initiation, stepped-leader propagation, upward leaders, attachment and return stroke.
- 7 stages
- Conceptual 3D model
- Illustrative geometry and current
-
In preparation
Lightning current parameters
Waveshapes, peak values and the statistics used in engineering studies.
Direct strokes to overhead lines
What happens when the flash terminates on a transmission line: shield wires, towers, insulation.
Part II
From Lightning Stroke to Backflashover
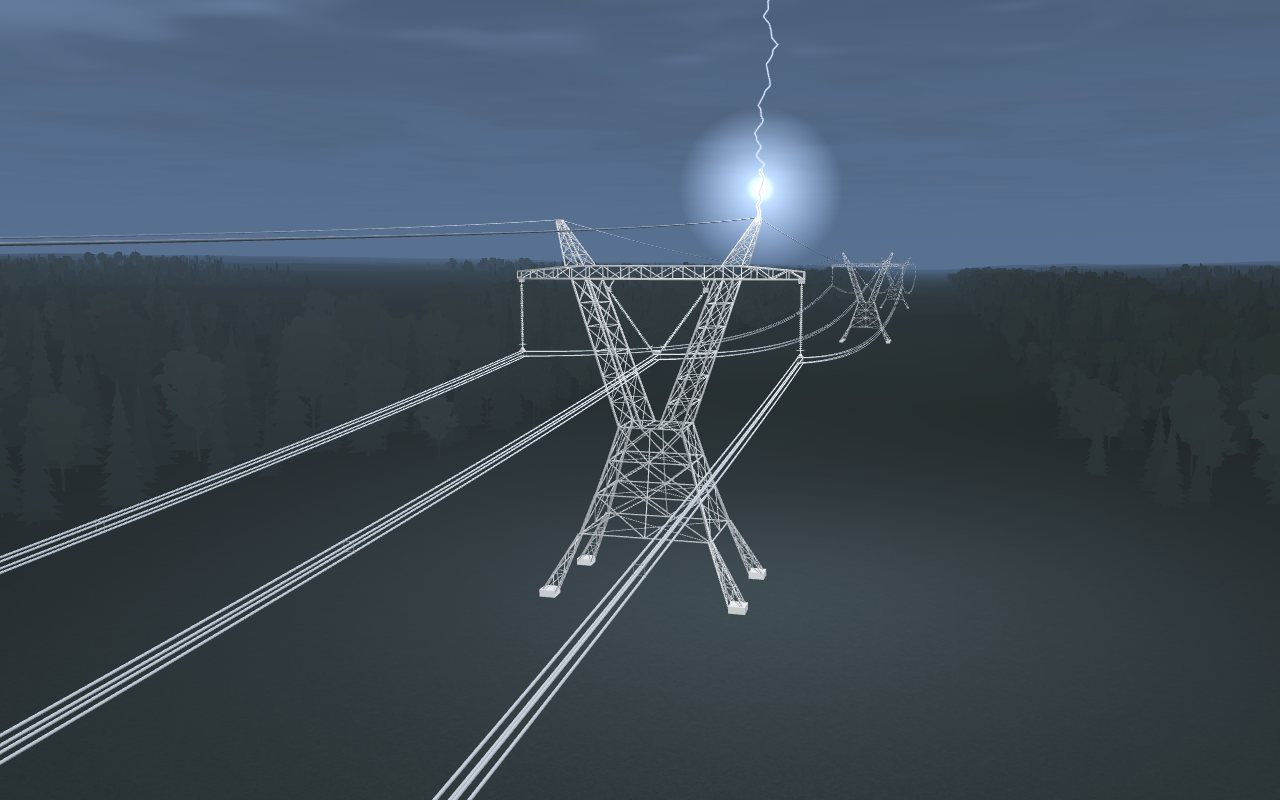
A 100 kA first negative stroke attaches to the shield wire at a tower of a 735 kV line. Follow the current division, the tower potential rise, the insulation stress and the backflashover, then the surge launched onto the phase conductor.
- 6 stages
- Replays an EMTP simulation
- 735 kV line, 300 m spans
-
In preparation
Shielding failure
The electrogeometric model and strokes that bypass the shield wires.
-
In preparation
Tower grounding
Footing impedance, soil ionisation and their effect on the backflashover.
Indirect strokes
Strokes to ground near a line and the overvoltages they induce on it.
-
In preparation
Lightning-induced overvoltages
Field-to-line coupling for a nearby stroke and the resulting voltages on distribution lines.
Protection
The devices and design choices that keep lightning surges within what the insulation can withstand.
-
In preparation
Surge arresters
How a metal-oxide arrester limits the surge, and why its distance from the equipment matters.
In the classroom
The modules are made to be projected and talked over.
Play it as a film
Press Play, or Space. A storyboard camera frames each stage in turn, and the speed can be set from 0.25× to 2×.
Stop at every stage
In Lecture mode the animation pauses at the start of each stage, so you can explain it before moving on. Drag the timeline to return to any instant.
Look around
Free orbit hands the camera to the mouse. Explore & learn opens the explanation of the current stage, and the graph panels follow the animation.
The modules run in the browser and need WebGL. A laptop or desktop with graphics acceleration switched on in the browser gives the smoothest playback; if a module feels slow, check that setting first.
What the models show
Part I is a conceptual model. Geometry, time scale and current are illustrative: it shows the sequence of events in a flash and makes no quantitative claim.
Part II replays a simulation. Voltages and currents come from an EMTP study of the struck line. Anything reconstructed for display is labelled as such inside the module.